


Updated:
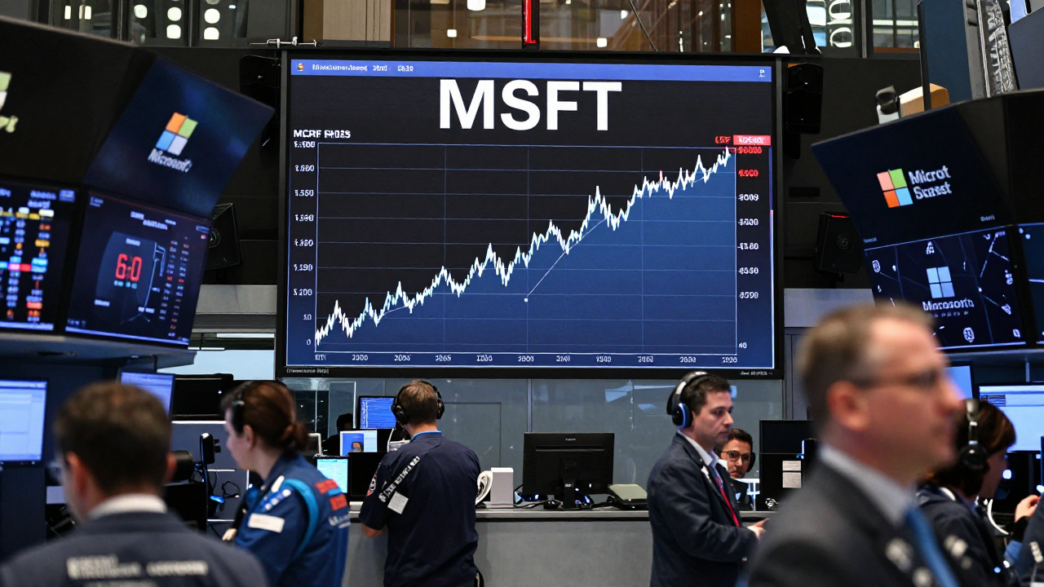
Microsoft shares have rebounded more than 50% from their June lows and are approaching the record high set in 2025, with a breakout above that level potentially extending the advance, according to a Reuters technical analysis published Thursday, October 8. The stock closed Wednesday at $529.76, less than 5% below its $555.45 all-time high, based on LSEG data cited in the report.
The rally’s next phase is uncertain. Reuters said Microsoft shares broke this week above a narrow trading range that had held from early August through late September, a move chart analysts interpret as a possible resumption of the climb. But the report also identified a fall below the $465-to-$480 area as a signal that the advance could be over for now.
Breakout follows weeks of sideways trading
Microsoft’s strong run began after the software company issued upbeat forecasts in July, Reuters reported. After rising sharply from June, the shares traded within a relatively tight range for several weeks, a pattern known in technical analysis as consolidation. Such pauses can follow rapid price gains as some investors take profits and others wait for the next move.
This week’s move above that range has drawn attention because it came as the stock neared its previous peak. A record high can act as a point of resistance if investors use it to sell shares; a sustained move above it, by contrast, may attract further buying, according to the technical framework described by Reuters. Neither outcome is assured by the chart pattern.
Momentum indicators point higher
Two indicators cited in the Reuters analysis—the 20-week Bollinger Bands and the moving average convergence divergence, or MACD—were both pointing to stronger momentum. Bollinger Bands widen as price volatility increases, while MACD compares moving averages of different lengths to gauge whether buying pressure is strengthening or weakening.
These measures describe recent price behavior rather than Microsoft’s future earnings or the underlying value of its business. Reuters noted that technical analysis uses historical price movements to assess the likelihood of future moves and does not guarantee a particular result.
Analysts’ projected range depends on a record break
Using the size of the stock’s advance before its consolidation, chart analysts projected a possible range of $700 to $750 if shares first clear the $555.45 record. That estimate is conditional, not a company forecast or a guaranteed target. The Reuters report did not identify the projection as a formal price target issued by a named investment bank.
The downside level highlighted in the analysis is $465 to $480. A retreat below that band would suggest the recent breakout had failed and the rally had lost its current technical footing, Reuters said. The report did not specify a time horizon for either the potential upside range or the downside threshold.
Broader market pressure complicates the outlook
The chart setup is unfolding amid market volatility tied to high oil prices and rising bond yields, Reuters reported. Associated Press coverage of Wednesday’s session showed U.S. equities pulling back from recent records: the S&P 500 fell 0.2%, the Dow Jones Industrial Average dropped 0.7% and the Nasdaq Composite declined 0.2%.
AP reported that the 10-year U.S. Treasury yield briefly reached 5.36% on Wednesday morning, near its highest level since 2002, before easing later in the session. Higher yields can weigh on stock valuations and increase borrowing costs, adding a wider-market risk to individual shares, including large technology companies.
Company had not commented
Microsoft had not immediately responded to Reuters’ request for comment, according to the report. The technical analysis did not identify a new company announcement as the trigger for this week’s move; it linked the broader advance to the forecasts released in July.
The immediate milestones for traders watching the chart are whether the stock can move through its $555.45 record and whether it can hold above the range broken this week. No future trading schedule or company event was specified in the reporting, and the technical indicators do not establish that either the projected upside or the downside threshold will be reached.