

Updated:
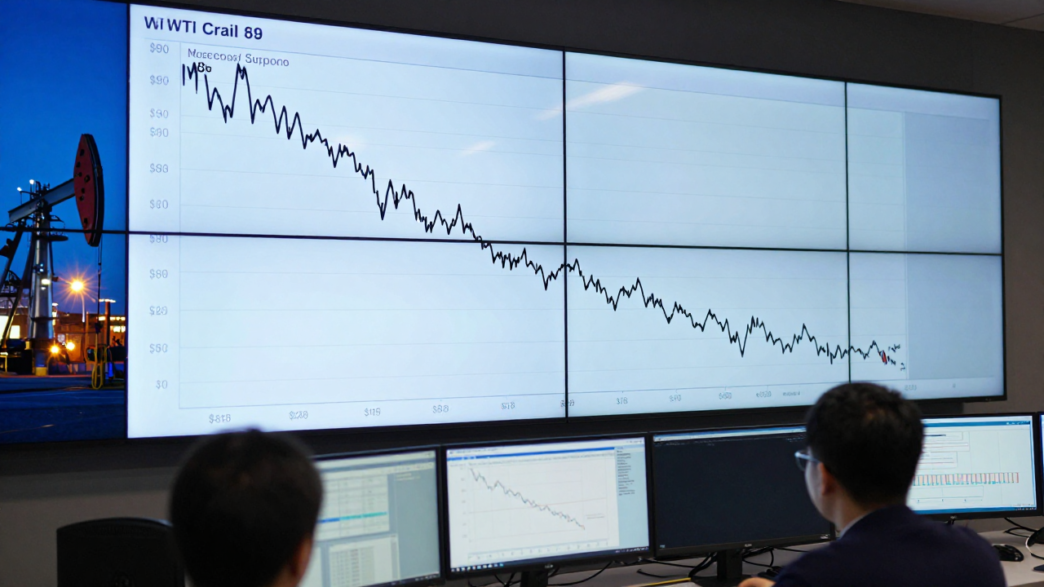
West Texas Intermediate crude was trading near $90.08 on a five-hour chart early Monday, October 5, as prices hovered around the 200-period simple moving average after falling from a recent high of $106.75. The technical setup described by Investing.com placed the market between that moving average, near $90.02–$90.08, and a support zone around $87.81–$88.00.
The chart assessment, updated at 07:10 UTC, described a confirmed head-and-shoulders top and downward momentum, while noting that the latest candle was a doji—a pattern associated with indecision. It also identified resistance at $91.58–$92.64, where the article said the Ichimoku cloud was positioned. These are technical levels, not evidence of a change in oil supply or demand.
A steep retreat from the recent high
WTI’s move from $106.75 to around $90 had brought the contract close to its 200-period average on the five-hour chart. The source characterized the decline as nearly 16% from the peak and said sellers remained in control of the chart structure. The referenced moving average is specific to that chart timeframe; it should not be confused with a daily 200-day average.
Investing.com’s technical analysis framed the head-and-shoulders pattern as completed, with the breakdown adding to the bearish case. Such chart patterns are used by technical analysts to describe price formations; they do not guarantee a particular outcome. In this instance, the article’s own support levels leave open the possibility that prices could stabilize rather than continue lower.
$87.81 support is the next key test
The report identified $87.81, described as a 50% Fibonacci retracement, and a nearby trendline around $88 as the main support area. It said the zone had acted as a floor, while warning that repeated tests could weaken it. The article did not provide evidence that the support had been decisively broken at the time of its update.
The assessment placed a broader watch zone between $87.50 and $88.50. A clear move below that range was presented as a bearish signal, with the report listing chart targets at $85.50, $83.35 and $80.20. Those figures were scenarios from the technical analysis, not price forecasts supported by company, government or market-wide fundamental data.
Resistance would need to give way for a rebound
On the upside, the immediate hurdle was the $91.50–$92.80 area, overlapping the reported Ichimoku-cloud resistance. The article said bulls would need a decisive close above $92.64 to provide stronger evidence of a reversal; without that confirmation, it warned that a brief rise could fail.
Its bullish scenario listed a move above $90.50 as an initial trigger and a break above $93 as a more conservative confirmation point. The potential upside levels shown were $96.50, $98.30 and $101.60. The source assigned the bullish setup low confidence and described overhead resistance as a constraint, underscoring that these were conditional chart scenarios.
Price action remains inconclusive near the average
The proximity of WTI to its 200-period average puts the $89.50–$91.00 area near the center of the immediate chart debate. Investing.com characterized that band as a choppy zone and cited the doji candle as a sign buyers and sellers had not established clear control. The source also described momentum and its SuperTrend indicator as bearish, but did not provide a separate volume series or broader market data to independently assess those signals.
The technical picture therefore hinges on whether WTI can hold the support cluster near $88 or reclaim the cloud resistance above $91.50. The report supplied no schedule for a catalyst or separate company, regulator or government response; its next milestones were chart levels rather than announced events. As with other technical analysis, those levels may change as prices move, and they do not establish why the market declined.