



Updated:
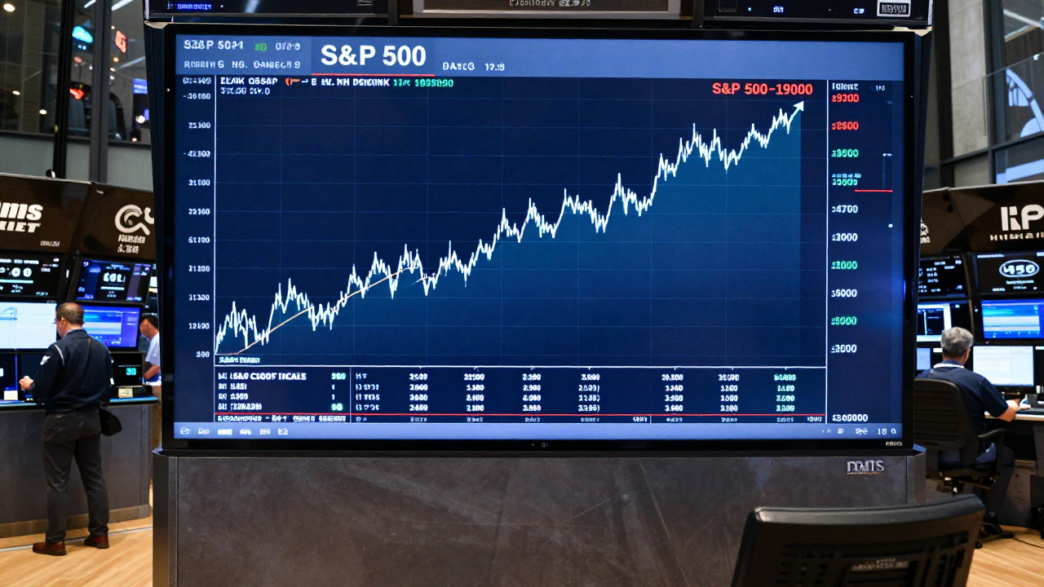
The S&P 500 reached a new record on Tuesday, October 6, even as a technical review published by Investing.com pointed to short-term overbought readings and weakening weekly momentum. The benchmark stood at 7,825.28 in the afternoon, up 0.66% on the day and just below its reported 52-week high of 7,844.90, according to the review.
The record came as investors weighed the index’s continuing upward trend against signs that the latest advance may be stretched. The technical assessment described a market with prices above key moving averages and subdued volatility, but also weak trend strength and several oscillators in overbought territory. Such indicators describe recent price behavior; they do not establish that a reversal is imminent.
A record high alongside mixed signals
The Associated Press reported that the S&P 500 rose 0.6% on Tuesday and surpassed its previous record, set in August. The index’s close at 7,819.04, shown in Investing.com’s market data, was up 0.58%. Those figures indicate a fresh closing high during a session in which the benchmark also traded above that level.
Investing.com’s analysis put the index’s year-to-date gain at 13.79% and its one-year rise at 16.11%, based on data displayed at the time of publication. It said the index was above every daily and weekly simple and exponential moving average it tracked. The daily 200-day simple moving average was 7,236.22, about 8% below the afternoon index level.
Oscillators flag near-term overbought conditions
The same review reported readings of 91.6 for the daily Stochastic RSI, 81.9 for the daily Stochastic and minus 8.4 for Williams %R, classifying each as overbought. On weekly charts, it also described the Stochastic reading of 83.2 and Ultimate Oscillator reading of 71.1 as overbought.
These measures compare recent price action with a range over a chosen period. High or low readings can signal that a move has been rapid, but, by themselves, they do not tell investors when or whether prices will turn. The article said that in the context of a weak trend, such readings could be consistent with consolidation rather than a market collapse.
Trend strength and volatility offer a more divided picture
Other indicators in the review were less unequivocal. The daily relative strength index was 62.7, which the article did not classify as stretched, and the daily MACD histogram was positive at 10.998. But the daily average directional index was 10.0 and the weekly reading was 14.4, figures the analysis cited as evidence of limited trend strength.
The weekly MACD histogram was slightly negative at minus 9.46, which the article interpreted as flattening weekly momentum. Meanwhile, the VIX, an index commonly used to gauge expected near-term volatility in the S&P 500, was reported at 15.07, well below its stated 52-week peak of 35.30. The source characterized that level as showing no panic, while noting that subdued volatility meant little fear was reflected in the measure.
Valuation and concentration risks cited, but not updated
To frame the technical readings, Investing.com referred to its earlier coverage of valuation, market concentration and oil-price risks. It said a June article had put the 10 largest S&P 500 companies near 40 times earnings and the cyclically adjusted price-to-earnings ratio near 40. The Oct. 6 piece did not provide updated calculations for either measure, so those figures should be understood as historical context from that earlier coverage, not fresh estimates.
The review also referenced earlier warnings that higher inflation and Treasury yields could pressure valuations, and that earnings from companies tied to artificial intelligence would need to support investor expectations. It explicitly cautioned that the cited articles dated from June through August and that inflation, yields, oil prices and expectations for Federal Reserve policy may have shifted since then. The article did not provide new data to quantify those risks.
What remains uncertain
Tuesday’s record confirms the index’s recent advance, while the technical indicators summarized by Investing.com describe potential vulnerabilities alongside the prevailing uptrend. The assessment did not identify a specific catalyst or timetable for a pullback, nor did it present company-level earnings revisions or a new valuation study.
The report’s central tension is therefore between price strength and limited confirmation from some measures of momentum. Whether the rally continues, pauses or reverses cannot be determined from the cited indicators alone; the source described its discussion as a framework rather than a directive.