

Updated:
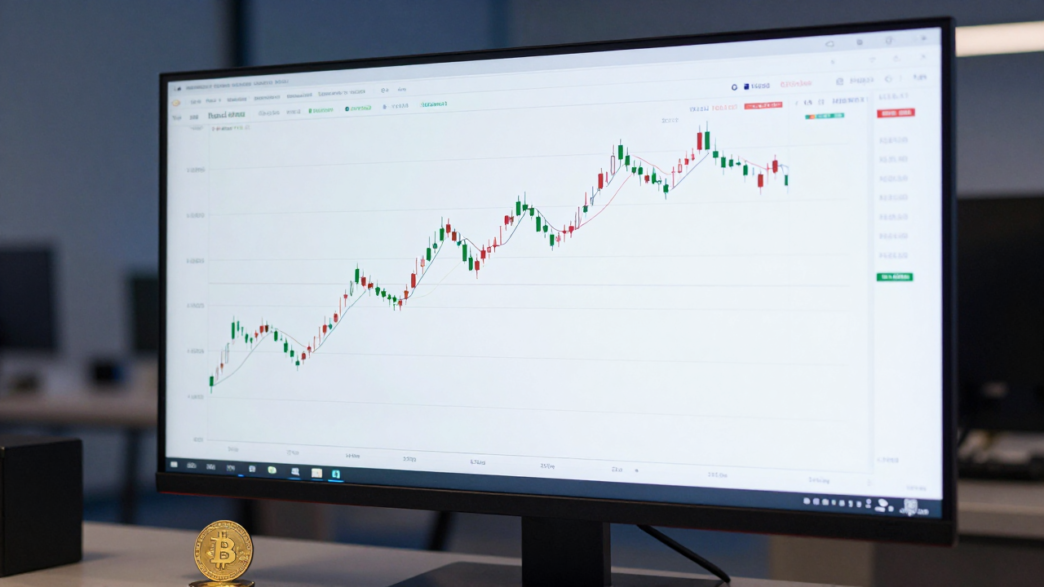
Bitcoin was trading near $84,947 in an October 3 update from Investing.com, positioned between chart levels that the report identified as potential support and resistance. Its five-hour chart analysis described a tightening consolidation, with a close above or below specified thresholds potentially signaling which side had gained short-term control.
The update placed support at $82,600–$83,552 and resistance at $86,800–$87,363. It also identified $86,195 and $83,552 as levels to watch for a decisive break, while cautioning that price action within the middle of the range remained vulnerable to reversals.
A narrow zone between buyers and sellers
Investing.com said Bitcoin had been moving inside a choppy range on the five-hour timeframe. At $84,947, the price sat above the cited support band but below the resistance area, leaving it between levels that the report associated with opposing trading signals.
The publication placed a cluster of moving averages and the Ichimoku cloud above $84,500, describing the area around the current price as a difficult zone for reading direction. In its assessment, trading within that cluster could produce unreliable moves rather than a clear trend signal.
The report also said the consolidation pattern was about 80% complete. That was the publication’s technical reading of the chart, not a confirmed timetable for a breakout. It did not establish when a move might occur or whether any eventual break would hold.
Momentum signals point in different directions
Several indicators in the update offered conflicting signals. Bitcoin remained above its 20-, 50- and 200-period simple moving averages on the five-hour chart, which the report cited as evidence that the broader trend on that timeframe remained intact.
At the same time, Investing.com noted that the moving average convergence divergence indicator, or MACD, had crossed bearishly. It also pointed to a lower high at $87,128 as a possible sign of weakening buying momentum. These observations did not confirm a broader reversal; they showed why the report characterized the immediate setup as uncertain.
A doji candle near $84,947 added to that uncertainty. The chart pattern reflects a session in which opening and closing prices are relatively close, and the publication interpreted it as evidence that buyers and sellers were closely matched. It also reported declining trading volume, meaning a move beyond the range would need renewed participation to provide stronger confirmation.
Levels the report identified for a break
On the upside, the report highlighted $85,215 as a five-hour closing level that would indicate a move above the Ichimoku cloud. It listed $86,195 as another threshold to watch, ahead of the $86,800–$87,363 resistance zone. The earlier lower high at $87,128 falls within that broader resistance band.
On the downside, $83,552 was the key level the publication said would put bears in a stronger position if Bitcoin closed below it on the five-hour chart. The lower support zone extended to $82,600, while a separate Fibonacci retracement level at $82,650 was cited as adding technical support near the lower boundary.
The source’s technical setup also listed possible trade entries, stops and targets for bullish and bearish scenarios. Those were chart-based scenarios from the publication, not confirmed market outcomes. Its central caveat was that price movements inside the cloud and moving-average cluster could reverse abruptly.
What remains unresolved
The October 3 update did not report a confirmed breakout from the range, nor did it identify a new fundamental catalyst driving Bitcoin’s price. Instead, it framed the market as awaiting clearer direction from price action around the stated thresholds and from trading volume accompanying any move.
For now, the levels are reference points from a short-term technical analysis, not guarantees of support or resistance. The report’s snapshot leaves the next direction unresolved: Bitcoin would need to move beyond the identified boundaries for the chart setup to offer a clearer signal.